What makes a winning NFL team?
Passing, rushing, and NFL scoring margins.
Picture credit: Link
Me and my friends always have arguments related to a variety of sports in our group chat. These discussions mostly stem from fantasy football and can get heated sometimes but they come from a place of passion. These dicussions allow us to grow our knowledge from different perspectives.
The NFL is interesting because there's many nuances and factors within the sport that we don't fully understand as non players but I understand stats and I'm looking for patterns to broaden my understanding about the sport.
I was recently reading Mathletics and came across the chapter "What makes NFL teams win?". It was quite interesting so I decided to do my own analysis and find out indicators of a winning NFL team.
In the early 1960s Bud Goode (sports statistician) studied the exact same question of what makes a team win. He found that yards per pass attempt in both offense and defense is one of the most important factors. So I decided to look at yards per attempt in rushing and passing both offensively and defensively to see if that had any impact on the scoring margin of a team.
The data is coming from nflverse's python package nflreadpy
We are only looking at the regular season games, these columns from the dataset will be used to build our features for two models we'll be using to predict the scoring margin. Linear Regression and XGBoost.
Passing gives us NPYA on offense and NDPYA on defense; rushing gives us NRYA and NDRYA. Both calculations use regular-season totals. For offense, we use the team's own numbers; for defense, we use its opponents' numbers from those same games.
Passing / Defense
Rushing / Defense
Sack yardage keeps the sign recorded in sack_yards_lost when added to passing yards.
For this analysis I decided to look at 3 different time frames of data in predicting the scoring margin. Data from 2015-2024, 2020-2024, 2022-2024. This is to see if our features change over different time periods or whether they remain consistent.
The correlation among the input variables can be observed in the figure below:
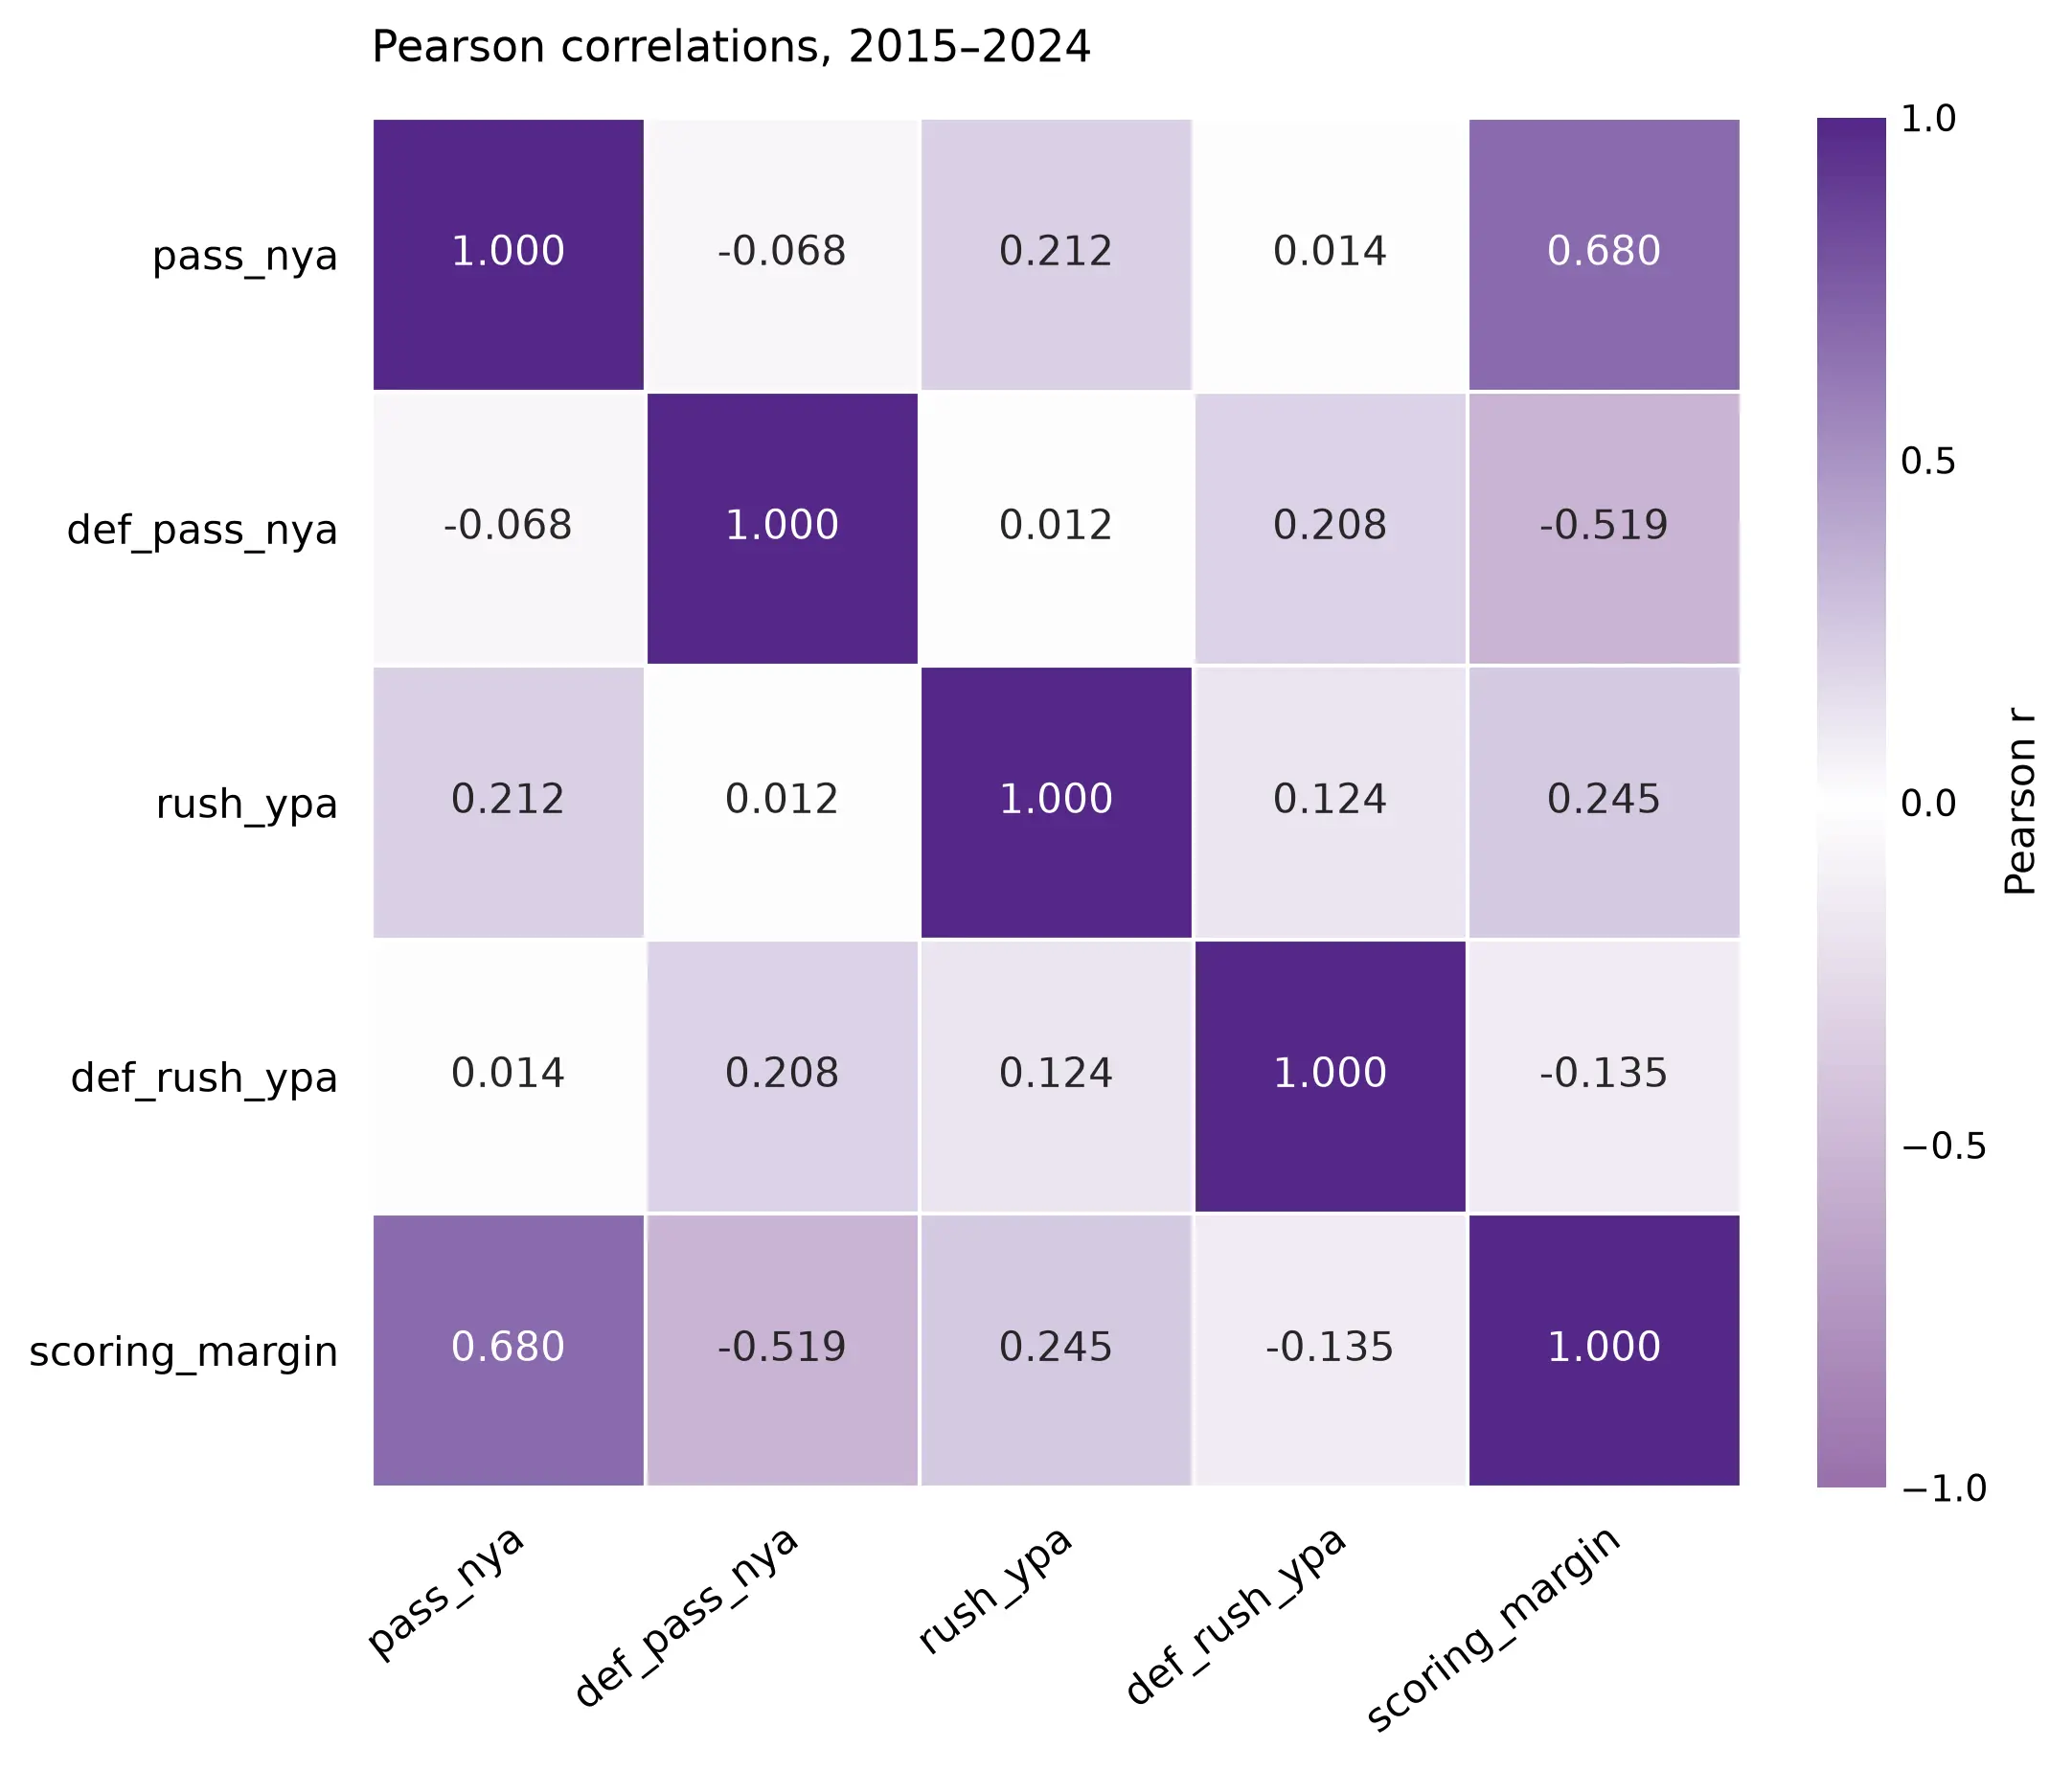
Figure 1: Correlation Matrix
The features themselves don't have much correlation among each other. NPYA and scoring margin have a positive correlation while NDPYA and scoring margin have a negative correlation. Its not strong but we expect these numbers to be the case because the teams that tend to pass better have higher scoring margins while the teams that allow teams to pass more efficiently reduce the scoring margin.
The scoring margin (target) is each team's average scoring margin per game over the regular season: points scored minus points allowed, averaged across its games.
These models are evaluated on the held-out 2025 season data, using each team's 2025 passing and rushing efficiency to estimate its average scoring margin per game.
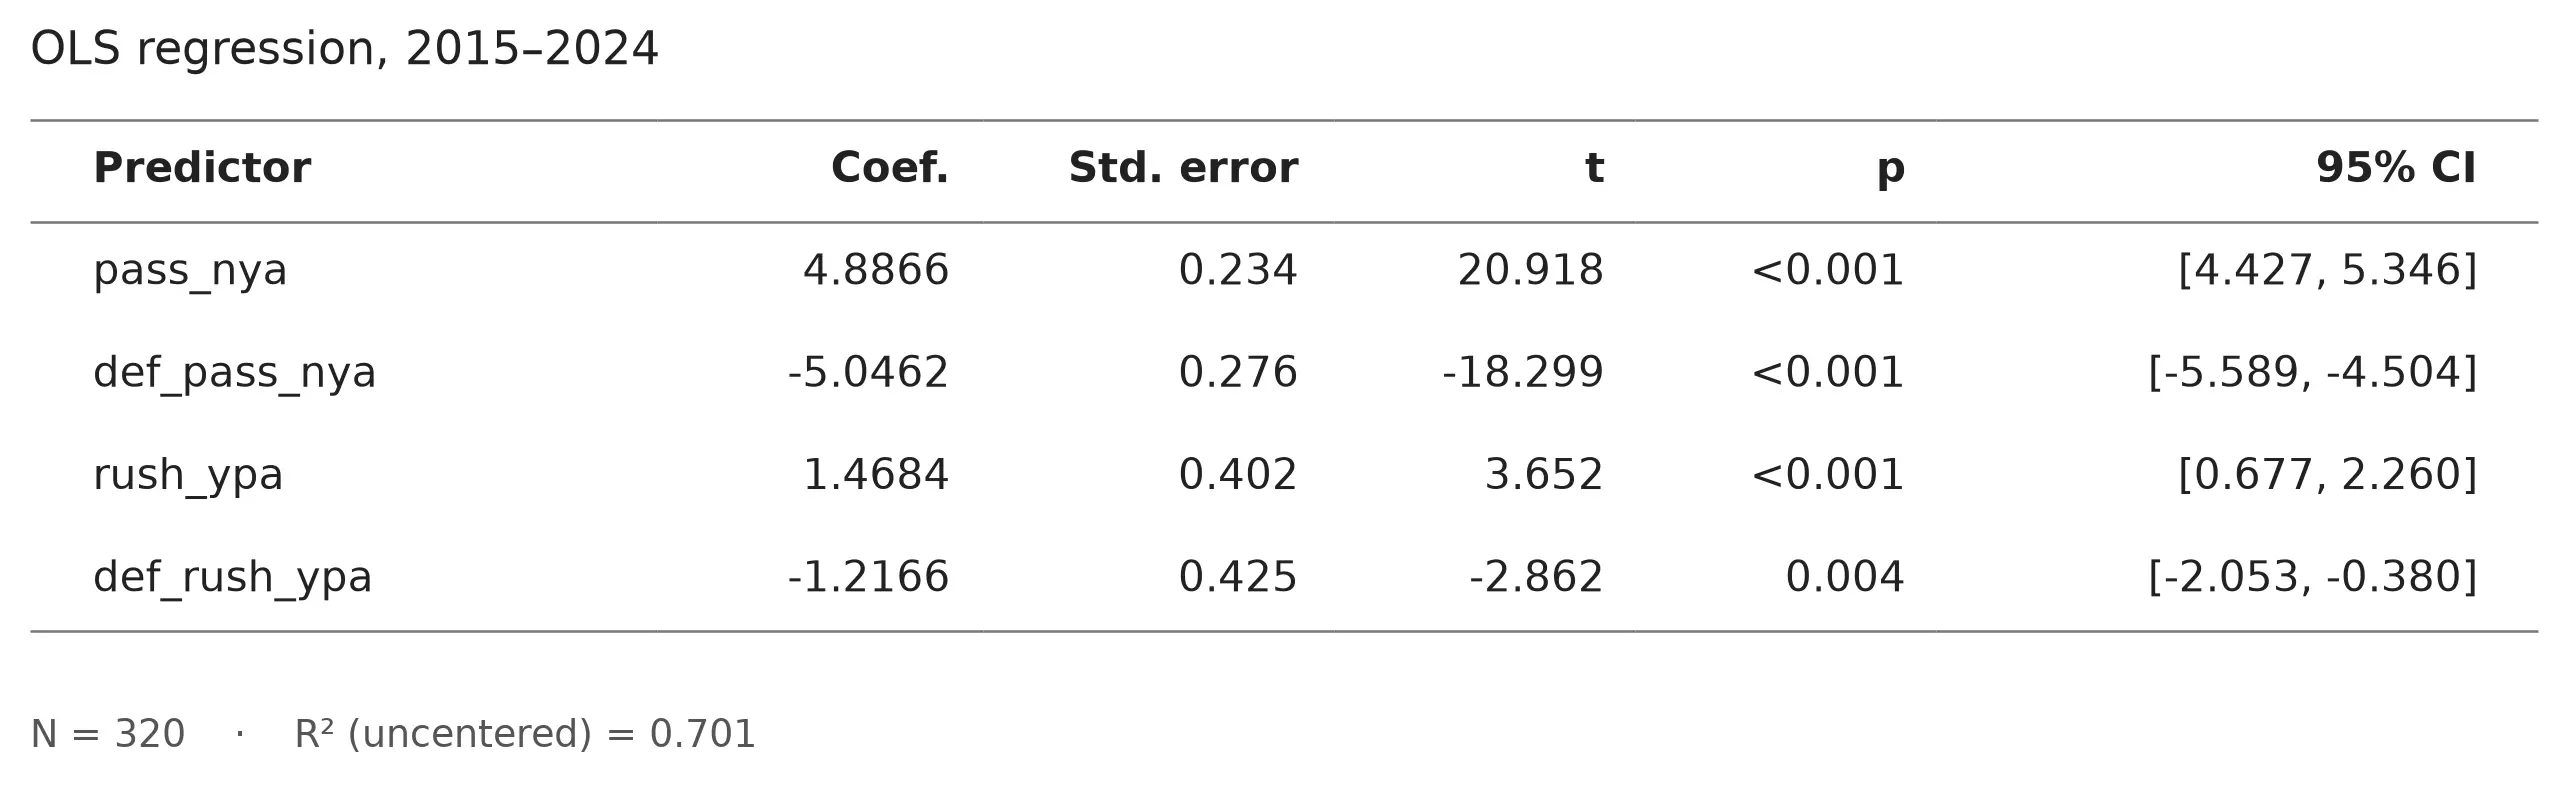
Figure 2: Linear Regression Results
For the 2015–2024 model, let be the predicted average scoring margin in points per game. Using rounded coefficients:
All four coefficients are statistically significant at the 5% level ().
Holding the other three features constant, the coefficients have the following interpretations:
- Passing offense: one additional net yard per passing attempt is associated with a 4.89 point higher predicted scoring margin per game.
- Passing defense: allowing one fewer net yard per passing attempt is associated with a 5.01 point higher predicted scoring margin per game.
- Rushing offense: one additional yard per carry is associated with a 1.47 point higher predicted scoring margin per game.
- Rushing defense: allowing one fewer yard per carry is associated with a 1.22 point higher predicted scoring margin per game.
We also observe that Passing yards per attempt have a significantly higher difference in scoring margin compared to rushing yards per attempt.
The negative defensive coefficients mean allowing more passing or rushing yards per attempt reduce the scoring margin. These coefficients make sense and remain consistent to Goode's findings.
Now let's see if these coefficients change over different time periods
| training_window | pass_nya | def_pass_nya | rush_ypa | def_rush_ypa |
|---|---|---|---|---|
| 2015-2024 | 4.8866 | -5.0162 | 1.4684 | -1.2166 |
| 2020-2024 | 4.7887 | -4.7466 | 1.4916 | -1.5536 |
| 2022-2024 | 4.8620 | -4.1053 | 0.3764 | -1.4461 |
Table 1: Coefficients from linear regression predicting average scoring margin per game
The coefficients remain similar however the model trained using data from 2022-2024 to predict scoring margin shows a drop in NRYA. This deserves a separate investigation to see if the smaller sample leads to this change or rushing efficiency is contributing lesser to scoring margin.
Lets look at how XGBoost compares to Regression models:
| Model | Training window | Training team-seasons | Train R² | Test R² |
|---|---|---|---|---|
| OLS | 2015-2024 | 320 | 0.701 | 0.831 |
| OLS | 2020-2024 | 160 | 0.700 | 0.835 |
| OLS | 2022-2024 | 96 | 0.704 | 0.830 |
| XGBoost | 2015-2024 | 320 | 0.776 | 0.791 |
| XGBoost | 2020-2024 | 160 | 0.825 | 0.743 |
| XGBoost | 2022-2024 | 96 | 0.857 | 0.687 |
Table 2: Training and 2025 test R² for OLS and XGBoost
These results are particularly interesting. OLS remains nearly constant across the three time periods for both training and test sets. This matches the findings in Table 1. However, the training for XGBoost improves with more recent data, while its test decreases. OLS appears to capture the meaningful signal better, while XGBoost may have overfit the data. Further tuning could improve XGBoost's performance but the simpler model generalizes better in this situation.
To end this, I'll leave y'all with the same question I came across in Mathletics. If it costs $10 million for an All-Pro receiver and $10 million for an All-Pro linebacker, which expenditure will improve team performance more? Our linebacker is going to impact NDPYA and NDRYA whereas the receiver is only going to impact NPYA.
My take: All pro receiver. Under my model an extra net yard per passing attempt increases the scoring margin by 5 pts. Obviously its very situation dependent and doesn't tell us if signing the player will actually change those numbers but its good food for thought.